Highlights
-
Stable Industry Continues to Grow:
The Australian private equity and venture capital (PE/VC) industry is
significant, with $30.3 billion of capital raised to date. The industry
continued to deploy capital into Australian and New Zealand companies
and distribute capital back to investors. In aggregate for the year
ending December 2021, the industry invested approximately $1.1 billion
and distributed more than $2.4 billion, net of fees, back to investors,
while the value of unrealized investments increased by $5.2 billion. By
net asset value as of 31 December 2021, buyout and growth equity
accounted for 64% of the index, with 36% in venture capital.
-
Strong Long-term Performance:
Australian PE/VC continues to demonstrate strong long-term net of fees
performance for investors, outpacing the ASX 300 and the ASX Small
Ordinaries for the 5, 10, and 20-year periods ending 31 December
2021—tracking between +5.9% and +11.5% ahead of the listed markets.
Long-term performance of the local market remained in line with global
peers.
-
Performance Snapshot:
Australian PE/VC delivered remarkable performance in 2021, with the
industry up +62.2% net of fees for the year ending December 2021. A
dramatic uplift in unrealized net asset value contributed to the
strongest one-year net IRR in 20 years. While public markets ended 2021
at historic highs, the downturn in public markets was a forward
indicator of PE/C returns heading into 2022. In Q1 2022 the industry
saw muted returns for the quarter. Australian PE/VC trailing 1-year
returns outpaced public markets equivalents and global peers, while
global macro factors outweighed the pandemic tailwinds.
-
Looking Ahead:
Trends present at the onset of 2022 – rising inflation, rising interest
rates and geopolitical instability and supply chain issues aggravated
by the Russian invasion of Ukraine – will continue to impact public and
private markets as the year unfolds. Historical performance in
Australian PE/VC remains strong, further enhanced by the notable 2021
returns. Realized returns are influenced by these multi-faceted impacts
along the way. For Australian PE/VC performance, manager value add will
be increasingly important amid influences from the economy, inflation,
interest rates, and public markets.
Long-Term Performance Remains Strong
Over longer periods, Australian PE and VC returns showed continued strong
long-term performance, delivering double digit net of fees returns over 5-,
10-, and 20-year periods (Figure 1). To measure mPME, Cambridge Associates
compared private equity performance to that of listed equities by
hypothetically ‘investing’ in the ASX 300 and the ASX Small Ordinaries at
the same time and equivalent amount as the private equity investments.
While it is generally accepted that the higher risk and illiquidity of
private equity require it to generate returns of +3% to +5% over listed
markets over time, the local PE and VC index has achieved this standard
hurdle across periods.
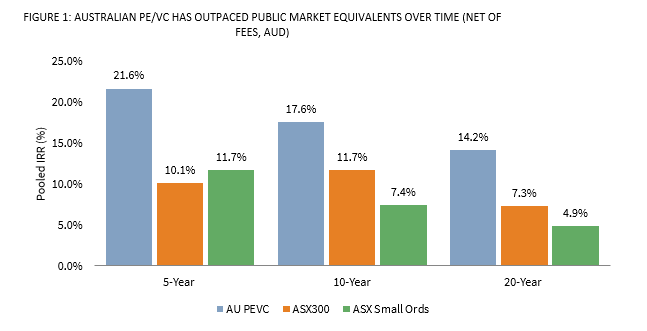
Source: Cambridge Associates Database, 31 December 2021, net of fees, expenses and carried interest. Returns presented in Australian Dollar terms.
Manager selection and the ability to access top performing managers
provided higher absolute returns net of fees and relative to the listed
markets. In the data gathered by Cambridge Associates, the top two
quartiles of Australian PE/VC funds exceeded returns of the broader
Australian PE/VC industry by +4.5% to +8.2% per annum over time, while also
outperforming the ASX 300 Index by +10.4% to +19.7% and the ASX Small
Ordinaries Index by +14.6% to +18.1% on a public market equivalent (mPME)
basis.
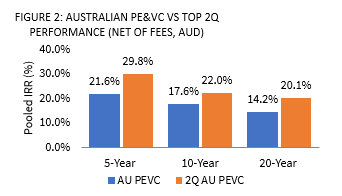
Source: Cambridge Associates Database, 31 December 2021, net of fees, expenses, and carried interest. Returns presented in Australian Dollar terms.
On a local currency basis, with each region measured in its base currency
unless noted otherwise, Australian PE/VC returns exceeded US and Asian
PE/VC peers while in line with European PE/VC over the 20-year period
(Figure 3). Over 5- and 10-year periods, Australian performance lagged US
and European PE/VC while outperforming Developed Asia PE/VC, reflecting
local market factors including interest rates, valuations, market depth and
sector exposures.
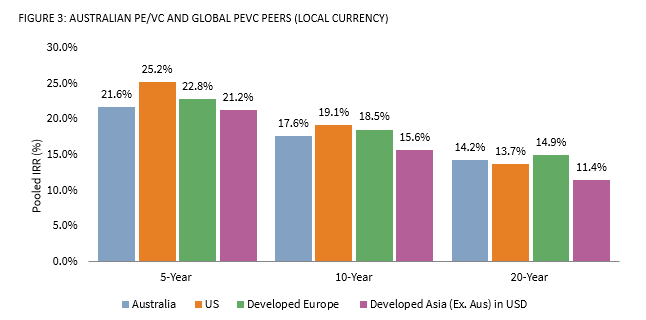
Source: Cambridge Associates Database, 31 December 2021, net of fees, expenses and carried interest. Returns presented in local currency terms.
A Year in Review
The Australian PE/VC Index was up a notable +62.2% for 2021, outperforming
the ASX 300 and ASX Small Ordinaries by 30.9% and by 31.5%, respectively
(Figure 4). The start of 2022 delivered more subdued performance. The
Australian PE/VC index had a pooled return of 0.2% in the first quarter –
the lowest quarterly return for the index since the start of the COVID-19
Pandemic (-6.5% for first quarter 2020). Australian PE/VC continued to
outpace its listed market equivalents for the trailing 1-year ending 31
March 2022, extending the outperformance relative to listed markets to
+38.5% and +43.7%, respectively.
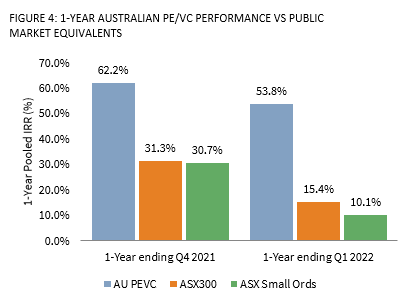
Source: Cambridge Associates Database, 31 March 2022, net of fees, expenses, and carried interest. Returns presented in Australian Dollar terms.
Australian PE/VC provided the strongest trailing 1-Year performance
relative to global peers (in local currency) for periods ending 31 December
2021 and 31 March 2021 (Figure 5). In 2021, Australian PE/VC performance
was driven by an uplift in net asset value relative to global peers, while
returns of global peers included increases in net to LP distributions as
well as a more modest uplift in net asset values. In the first quarter of
2022, Australian PE/VC’s quarterly pooled net IRR of 0.2% held up better
than that of global peers in local currency. Strong net to LP distributions
and a steady NAV underwrote Australian PE/VC returns in Q1 2022, while the
pooled quarterly return of global peers was impacted by negative
adjustments to NAV and low levels of distributions.
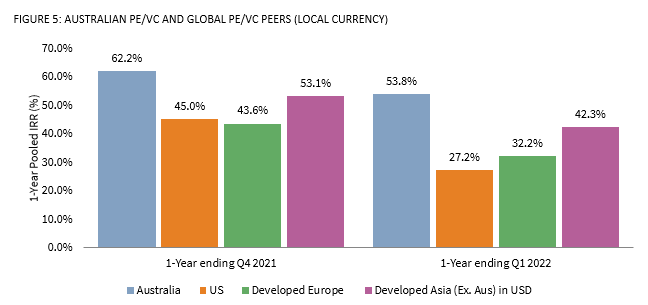
Source: Cambridge Associates Database, 31 March 2022, net of fees, expenses and carried interest. Returns presented in local currency terms.
While it is useful to measure the industry’s cash flows over a quarterly or
12-month period to provide a snapshot of recent market volatility, this
periodicity does not provide a meaningful performance indicator for a
long-term asset class. Private equity and venture capital performance is
measured over the medium to long-term (5- to 20-year periods) to align
performance with the strategy of acquiring and divesting investment assets.
As of 31 March 2022, the Australian PE/VC index continued to be dominated
by four key sectors: IT, Consumer, Healthcare, and Industrials (Figure 6).
In Q1 2022, the Australian PE/VC Index invested capital into Industrials,
Consumer Discretionary, and IT companies and realizations came from
companies in the Healthcare, Industrials, and Consumer Discretionary
sectors.
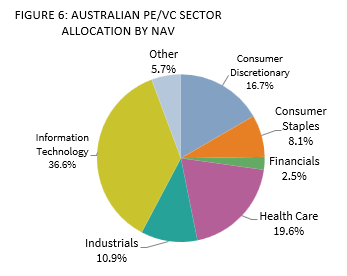
Source: Cambridge Associates Database, 31 March 2022, gross of fees, expenses and carried interest. Other includes Communications Services, Energy, Materials, Real Estate, and Utilities.
Australian PE/VC Index sector “winners” for 2021 included: IT, Consumer
Staples, Healthcare, and Industrials, and performance in the IT sector
dominated the trailing 1-year returns. Financials continued to make modest
gains during the period, though trails strong performance of the broader
index. In Q1 2022, IT and Consumer Staples lagged the other sector returns,
while Financials showed the strongest performance. While this quarterly
update provides a reference to PE/VC performance during the period, it is a
very short time frame of data for strategies that typically manage
investments with a three- to seven-year holding period.
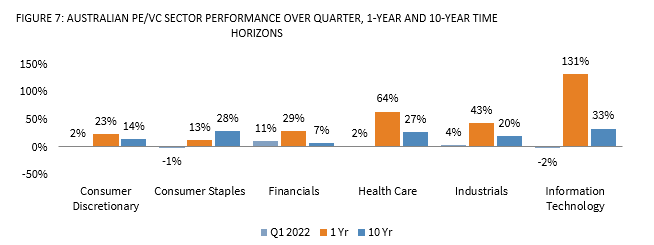
Source: Cambridge Associates Database, 31 March 2022, gross of fees, expenses and carried interest. Returns presented in Australian Dollar terms.